


Topic 1: United States election should have limited impact on global markets
The upcoming 2024 United States (US) presidential election is shaping up to be a close race between incumbent Democrat president Joe Biden and former Republican president Donald Trump.
Historically, the results of US elections have had minimal impact on financial markets as market performance is more closely tied to the state of the US economy rather than election results. However, policies put forth by each candidate have the potential to affect the economy in different ways (Figure 8).

* North Atlantic Treaty Organisation (NATO) is an alliance between 32 countries from Europe and North America. It provides a unique link between the two continents, enabling them to consult and cooperate in the area of defence and security.
Source: UOB PFS Investment Strategists (31 May 2024)
Policy choices will have different implications
Tax policies may be particularly impactful on the US economy as well as financial markets. Many of the tax benefits from Trump’s 2017 Tax Cuts and Jobs Act will expire in 2025, notably the expiration of individual income tax cuts. Corporate tax cuts under the Act are, however, permanent. Trump has pledged to renew tax cuts for individuals and vowed to reduce the corporate tax rate from 21% to 20%. His proposal will disproportionately benefit wealthy households and businesses, boosting the economy and stock markets but widening the US budget deficit. In contrast, Biden’s proposed tax increase on large companies and wealthy individuals would bolster government income and narrow the budget deficit, allowing the government to spend on the economy when required.
US trade policy will be important for the global economy, regardless of who wins the election. Both candidates are proposing tougher measures towards China, which could escalate US-China tensions. However, the approach and economic impact differ.
Biden’s tariff proposals target strategic areas in security and technology but may not cause major economic disruptions. In contrast, Trump’s proposed universal tariffs could significantly disrupt global trade, raise import prices and increase inflation. This would constrain the US Federal Reserve’s (Fed) ability to ease monetary policy and strengthen the US dollar (USD).
The full economic impact of escalating US-China tensions may not be felt until the second half of 2025 onwards. Consultations with trade groups and companies need to happen beforehand, and implementation of new tariffs may only occur in late 2025. In the meantime, companies in the US and China will likely front-load trade to avoid potential tariff hikes, benefitting the global trade outlook for the next six to 12 months.
Trump prioritises an “America First” foreign policy agenda![]() that involves reducing foreign spending, contrary to Biden’s stance. This could accelerate global geopolitical tensions, potentially benefitting defence companies due to increased military investments.
that involves reducing foreign spending, contrary to Biden’s stance. This could accelerate global geopolitical tensions, potentially benefitting defence companies due to increased military investments.
Lastly, immigration is a pivotal issue in this election. Both candidates advocate stricter immigration controls. A slowdown in immigration flows may tighten the US labour market, a driver of current economic growth.
US stock markets have typically risen in the first year after US presidential elections
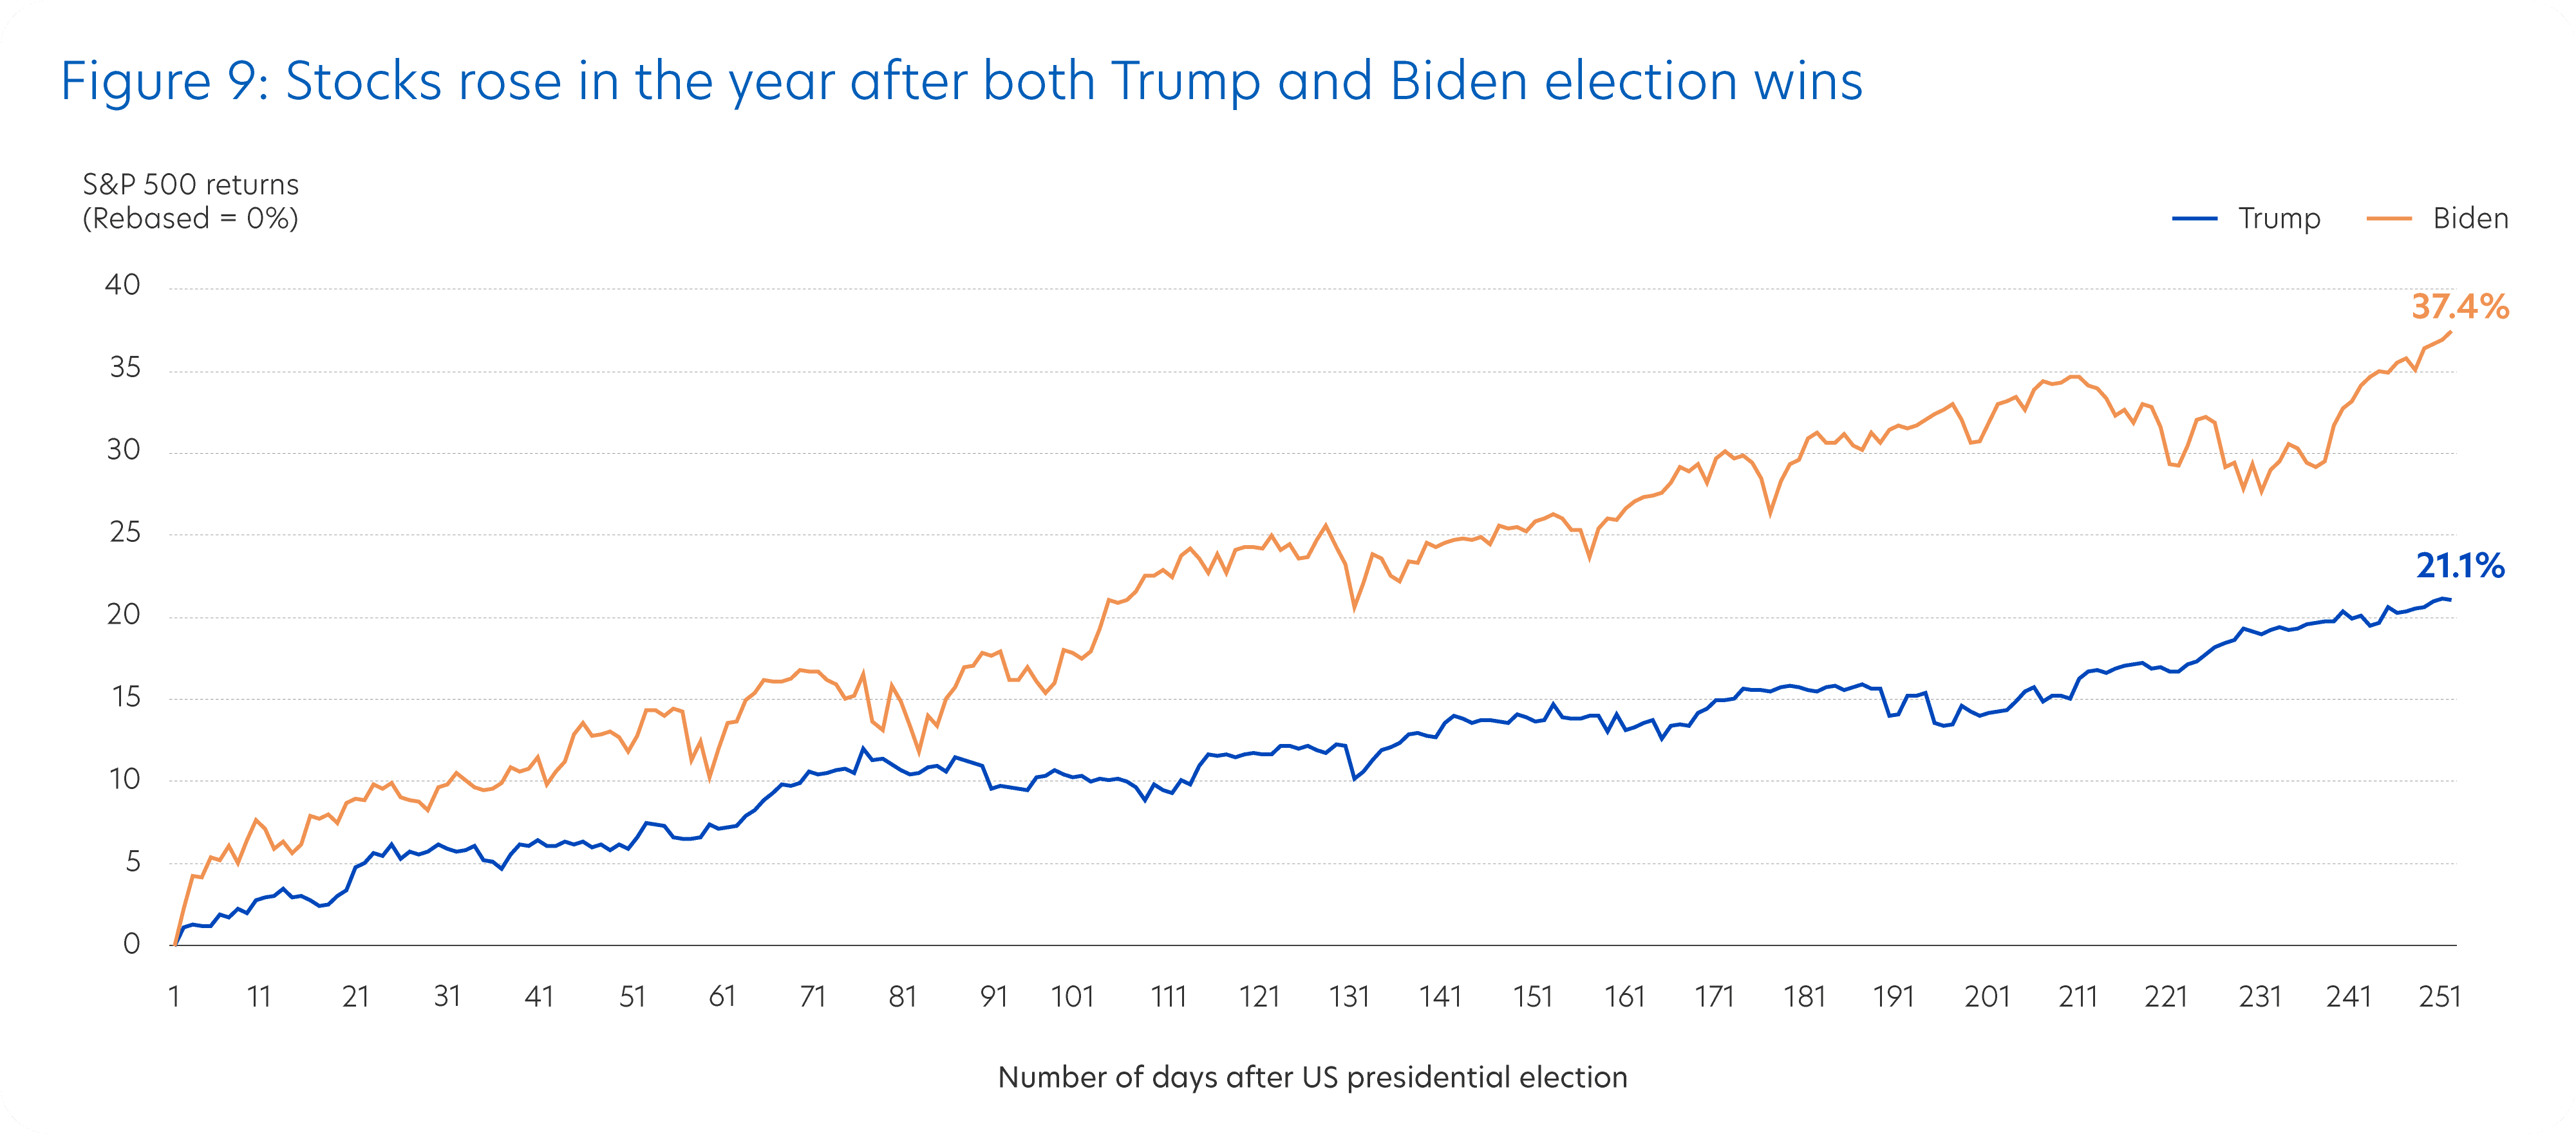
Historically, political uncertainties had not had a big impact on stock markets. The S&P 500 Index generally rose before elections, even during recessions![]() .
.
In the first year of both Trump’s and Biden’s previous terms after the 2016 and 2020 elections, the S&P 500 also saw significant gains of 21.1% and 37.4%, respectively (Figure 9).
Source: Bloomberg (31 May 2024)
In summary, stocks can still perform well under either a Trump or Biden administration, as seen in their previous first years in office. Avoid focusing excessively on media speculation about the election and potential policy changes that may lead to trade tensions. Economic fundamentals matter more. With a resilient economy, invest in quality stocks and use a consistent dollar-cost averaging approach to mitigate risk.
Topic 2: Artificial intelligence stocks dominate but other opportunities exist
The Magnificent Seven, United States (US) mega-cap technology stocks, have dominated the market rally in a high interest rate environment, powered by optimism over artificial intelligence (AI). AI will continue to be a big investment theme this year as it is starting to transform businesses. However, attractive opportunities also exist outside of these stocks. Diversify your portfolio to capture different opportunities as market trends shift.
Corporate earnings set to improve across major stock markets
Corporate earnings drive stock performance, exemplified by the Magnificent Seven. In 2023, strong earnings growth fuelled their stellar performance, while a fall in earnings in other companies led to the underperformance of the broader stock market.
Investor confidence has grown as the global economy demonstrates resilience in a high interest rate environment. This confidence has been bolstered by expectations of interest rate cuts later this year and a recovery in global trade. Additionally, the earnings outlook for 2024 is set to improve across major stock markets with increasing adoption of generative AI leading to lower costs and higher productivity over time.
Magnificent Seven companies as a group are expected to report strong earnings growth once again this year although, individually, some are likely to do better than others. However, earnings growth momentum in other stock markets is likely to be even stronger (Figure 10). While AI stocks can continue to do well, we should not ignore opportunities beyond those from the Magnificent Seven.
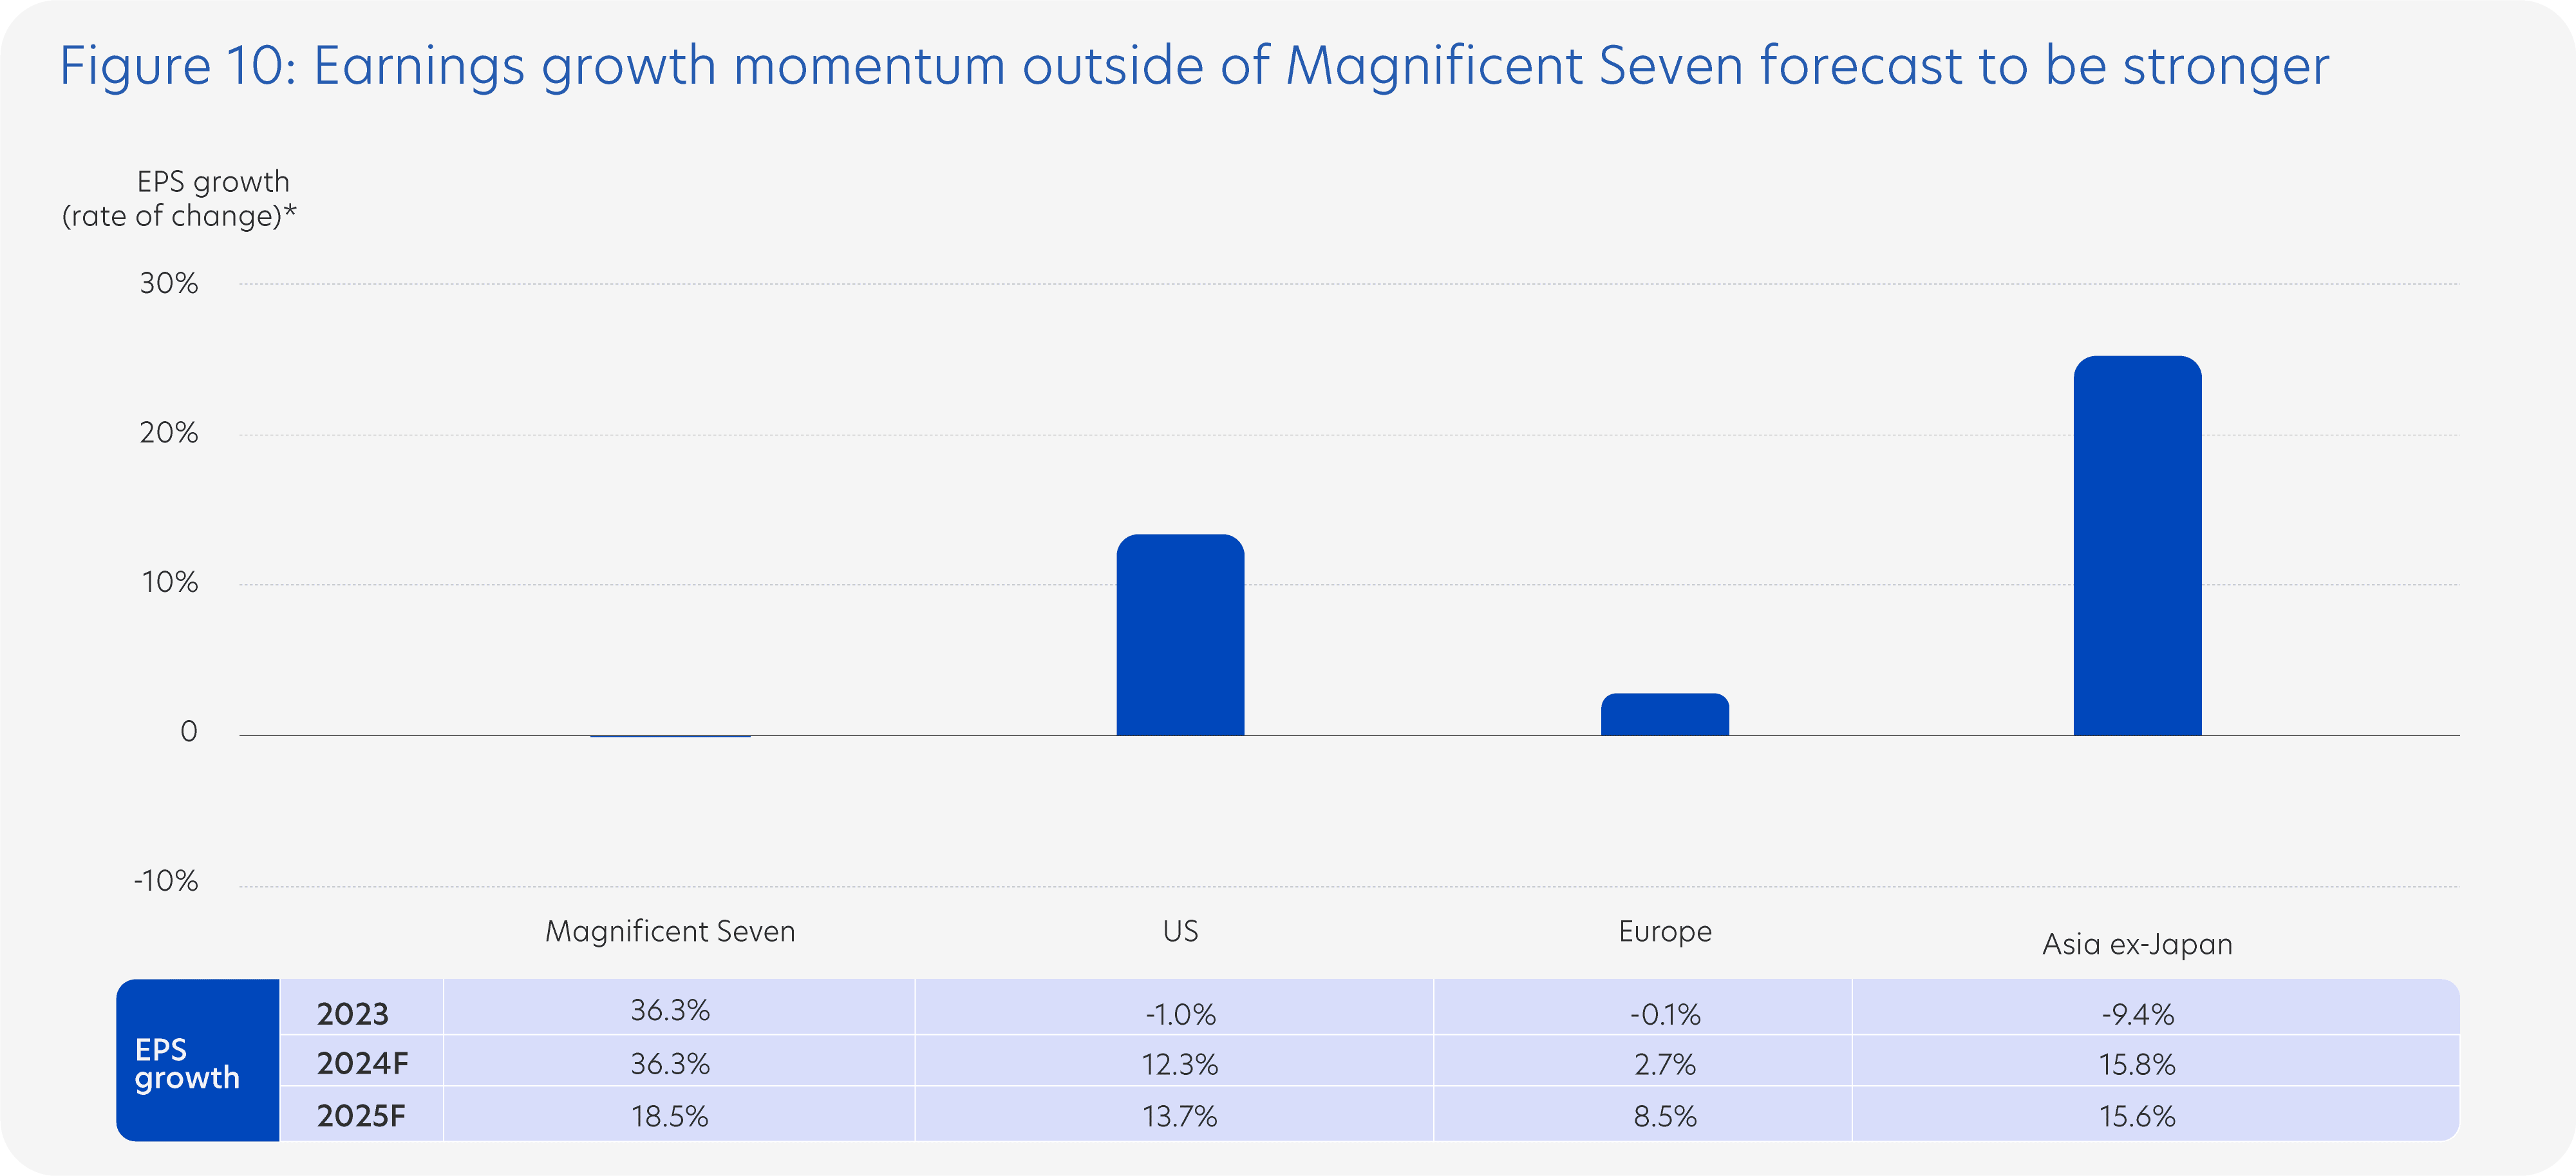
Earnings per share (EPS) is a key indicator to measure a company's financial health and profitability for each stock. F represents forecast data by analysts. Magnificent Seven refers to a group of US mega tech stocks. US refers to S&P 500 Index. Europe refers to Stoxx Europe 600 Index. Asia ex-Japan refers to MSCI Asia ex-Japan Index.
* The rate of change for EPS growth = 2024 EPS growth - 2023 EPS growth
Source: Bloomberg (31 May 2024)
Look for investment opportunities via valuation
Valuation is another crucial factor to consider when seeking investment opportunities. While the rally in the Magnificent Seven is supported by exceptional earnings growth, these stocks are no longer cheap after delivering total returns between 45% to 650%![]() since 2023.
since 2023.
Valuations in the broader US, European and Asia ex-Japan stock markets are attractive when compared with the Magnificent Seven. Stocks in Europe and Asia ex-Japan in particular are also cheaper than their 10-year averages.
Taking both earnings and valuation into account, Asia ex-Japan presents attractive investment opportunities, with lower valuations and stronger earnings growth momentum (Figure 11). Although stocks in the broader US market are slightly more expensive, earnings growth momentum is also strong, thanks to the recovery in manufacturing activity as half of S&P 500 earnings come from goods and manufacturing![]() . In contrast, earnings growth momentum in Europe is weaker, but the prospect of more European Central Bank (ECB) rate cuts will benefit European stocks, particularly large-cap quality stocks and stocks that have a track record of paying dividends.
. In contrast, earnings growth momentum in Europe is weaker, but the prospect of more European Central Bank (ECB) rate cuts will benefit European stocks, particularly large-cap quality stocks and stocks that have a track record of paying dividends.
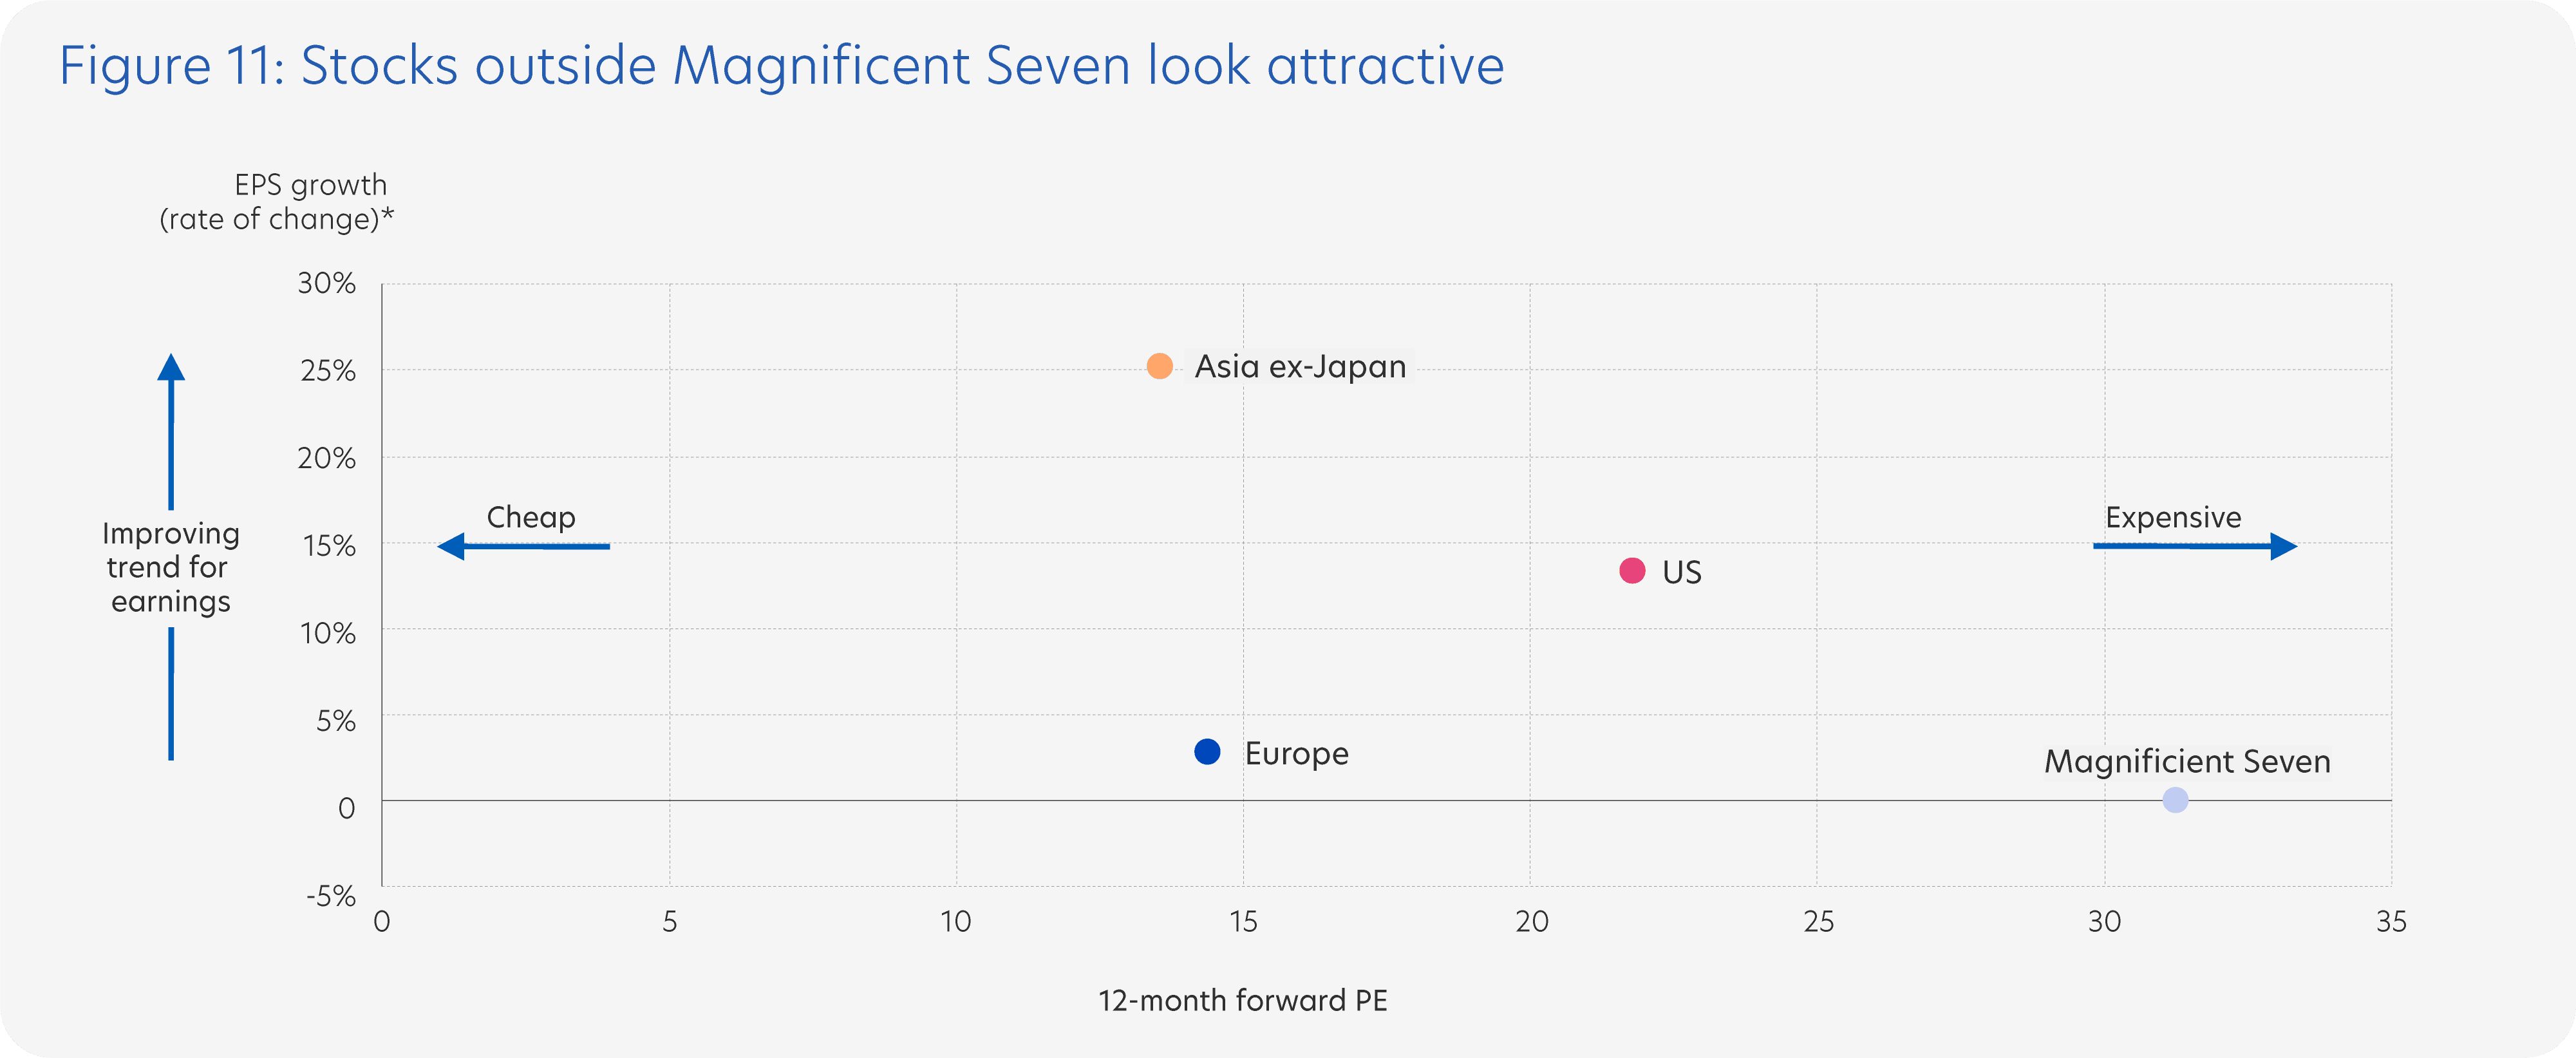
Earnings per share (EPS) is a key indicator measuring the financial health and profitability of a company. The 12-month forward Price-to Earnings (P/E) ratio is a financial metric that measures a company’s current stock price relative to its projected EPS over the next 12 months. Magnificent Seven refers to a group of US mega tech stocks. US represented by S&P 500 Index. Europe represented by Stoxx Europe 600 Index. Asia ex-Japan represented by MSCI Asia ex-Japan Index.
* The rate of change for EPS growth = 2024 EPS growth - 2023 EPS growth
Source: Bloomberg (31 May 2024)
Diversify to capture different market opportunities
While Magnificent Seven companies may continue to attract attention this year from strong earnings and the AI trend, there are other attractive opportunities outside of these stocks to consider. Diversifying your investments allows you to capture shifts in market opportunities as they arise and reduce concentration risk.
Topic 3: Balance income and growth with a mix of bonds and dividend stocks
In recent years, higher yields have made bonds more appealing. However, for many investors, bonds by themselves may not provide sufficient wealth growth or protection against inflation.
Dividend stocks can complement bonds by offering potential for income growth. With stocks expected to outperform bonds and cash again this year, combining bonds with dividend stocks gives investors opportunity for both investment income and capital growth.
Stock dividends continue to rise
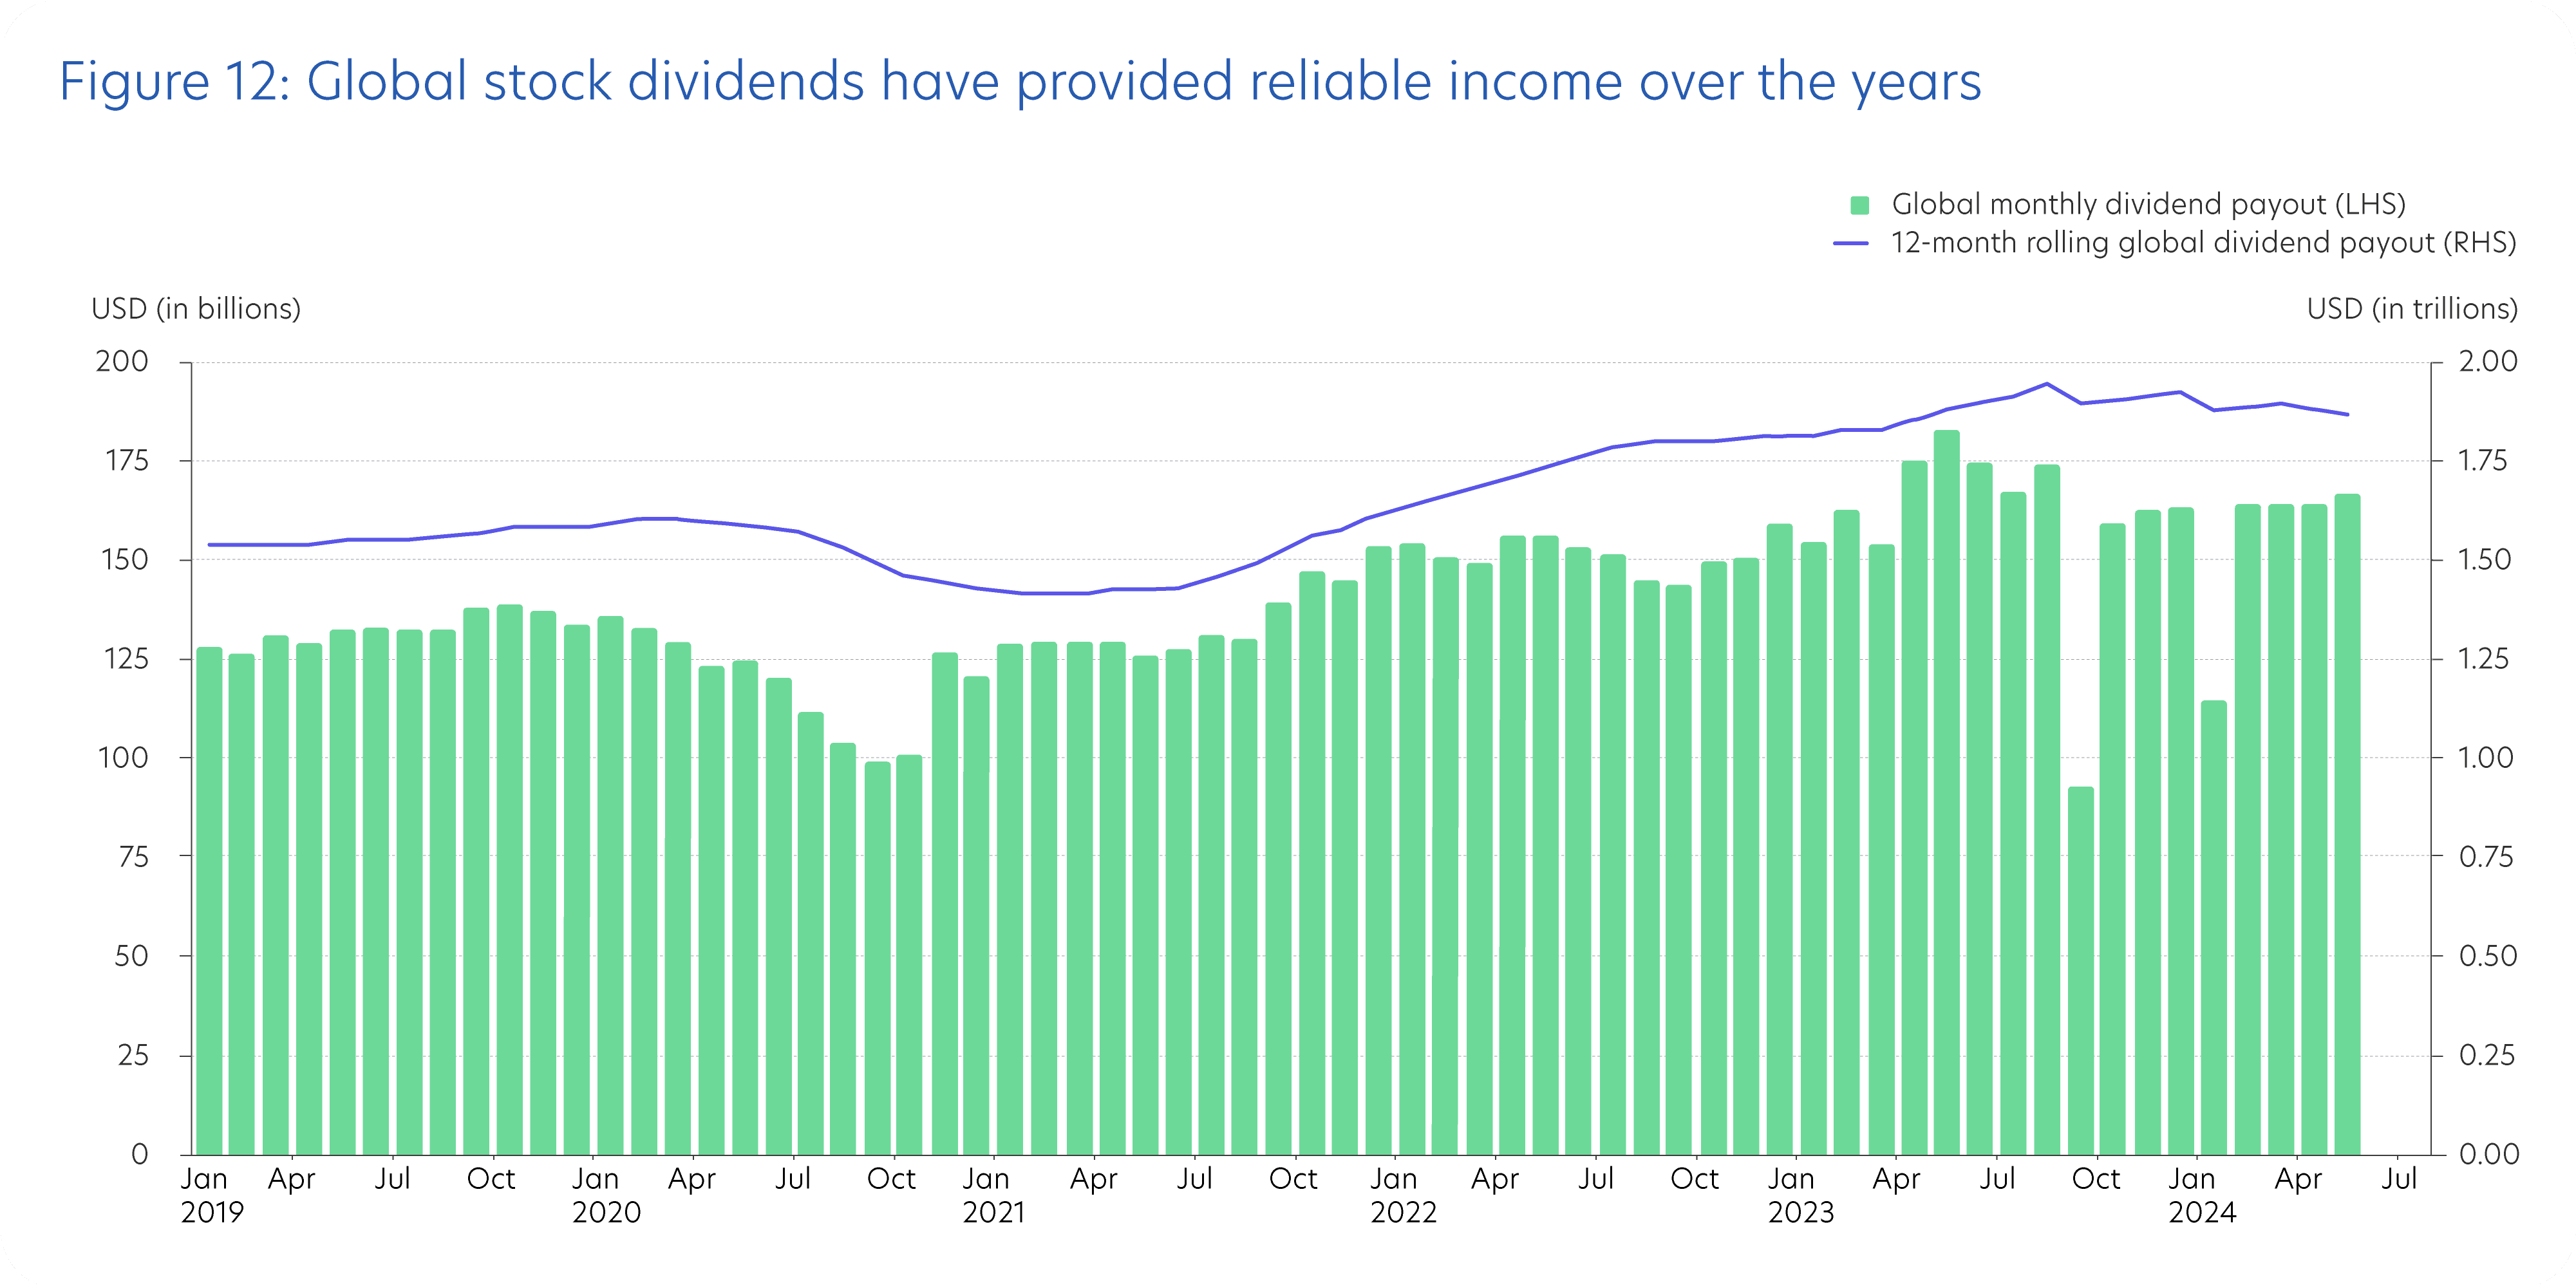
Global dividend payouts struggled to keep up with high inflation and interest rates in 2023. However, in the fourth quarter of 2023, global dividends increased 5.8% year-over-year, reversing a 1.3% decline from the previous quarter and ending the slowdown in growth observed since 2022 (Figure 12). The full-year payouts for 2023 amounted to USD1.92 trillion, a 5.7% increase from the previous year. With stronger corporate earnings, dividends are set to rise further in 2024.
Over a longer timeframe, the outlook for dividend growth appears even more favourable. Dividend payouts have been growing over the past five years on a rolling 12-month basis. On a total return basis, global dividend stocks![]() have gained 71% from 2019 to 31 May 2024, at an annualised rate of 11.3%
have gained 71% from 2019 to 31 May 2024, at an annualised rate of 11.3%![]() , exceeding average global inflation
, exceeding average global inflation![]() by a substantial margin.
by a substantial margin.
Despite major challenges such as the COVID-19 pandemic, geopolitical tensions threatening to disrupt supply chains, and a rapid rate hike cycle, global dividend stocks have demonstrated their reliability as a source of real income![]() .
.
Source: UOB PFS Investment Strategists, Factset, Macrobond (31 May 2024)
Potential capital growth for dividend stocks
The MSCI World High Dividend Yield Index has price-to-earnings (P/E) of 14.2x, which is fairly priced compared to its 10-year average of 14.7x. When compared to broader markets, the MSCI World High Dividend Yield Index is trading 27% lower than the MSCI World Index, which is considerably below the 10-year average discount of 17%![]() . This disparity suggests that dividend stocks have the potential for greater gains, particularly if the market rally continues to broaden.
. This disparity suggests that dividend stocks have the potential for greater gains, particularly if the market rally continues to broaden.
Dividend stocks can be volatile and dividends may be uneven
Dividend stocks can serve as strong building blocks for generating reliable income, offering the potential for capital growth and hedging against high inflation and interest rates. These are advantages a pure bond portfolio lack.
However, it is important to recognise that dividend stocks carry higher risks compared to bonds. They can exhibit higher volatility and may experience significant price fluctuations, especially when dividends fall. In contrast, bonds may be more stable due to regular coupon payments, making them more predictable in terms of income flow.
Seeking a balance between income and growth depends on your risk appetite
By combining dividend-paying stocks and investment grade bonds, you can achieve an income-generating portfolio suited to your risk appetite, something not as easily achievable with a portfolio consisting solely of bonds or dividend stocks (Figure 13).
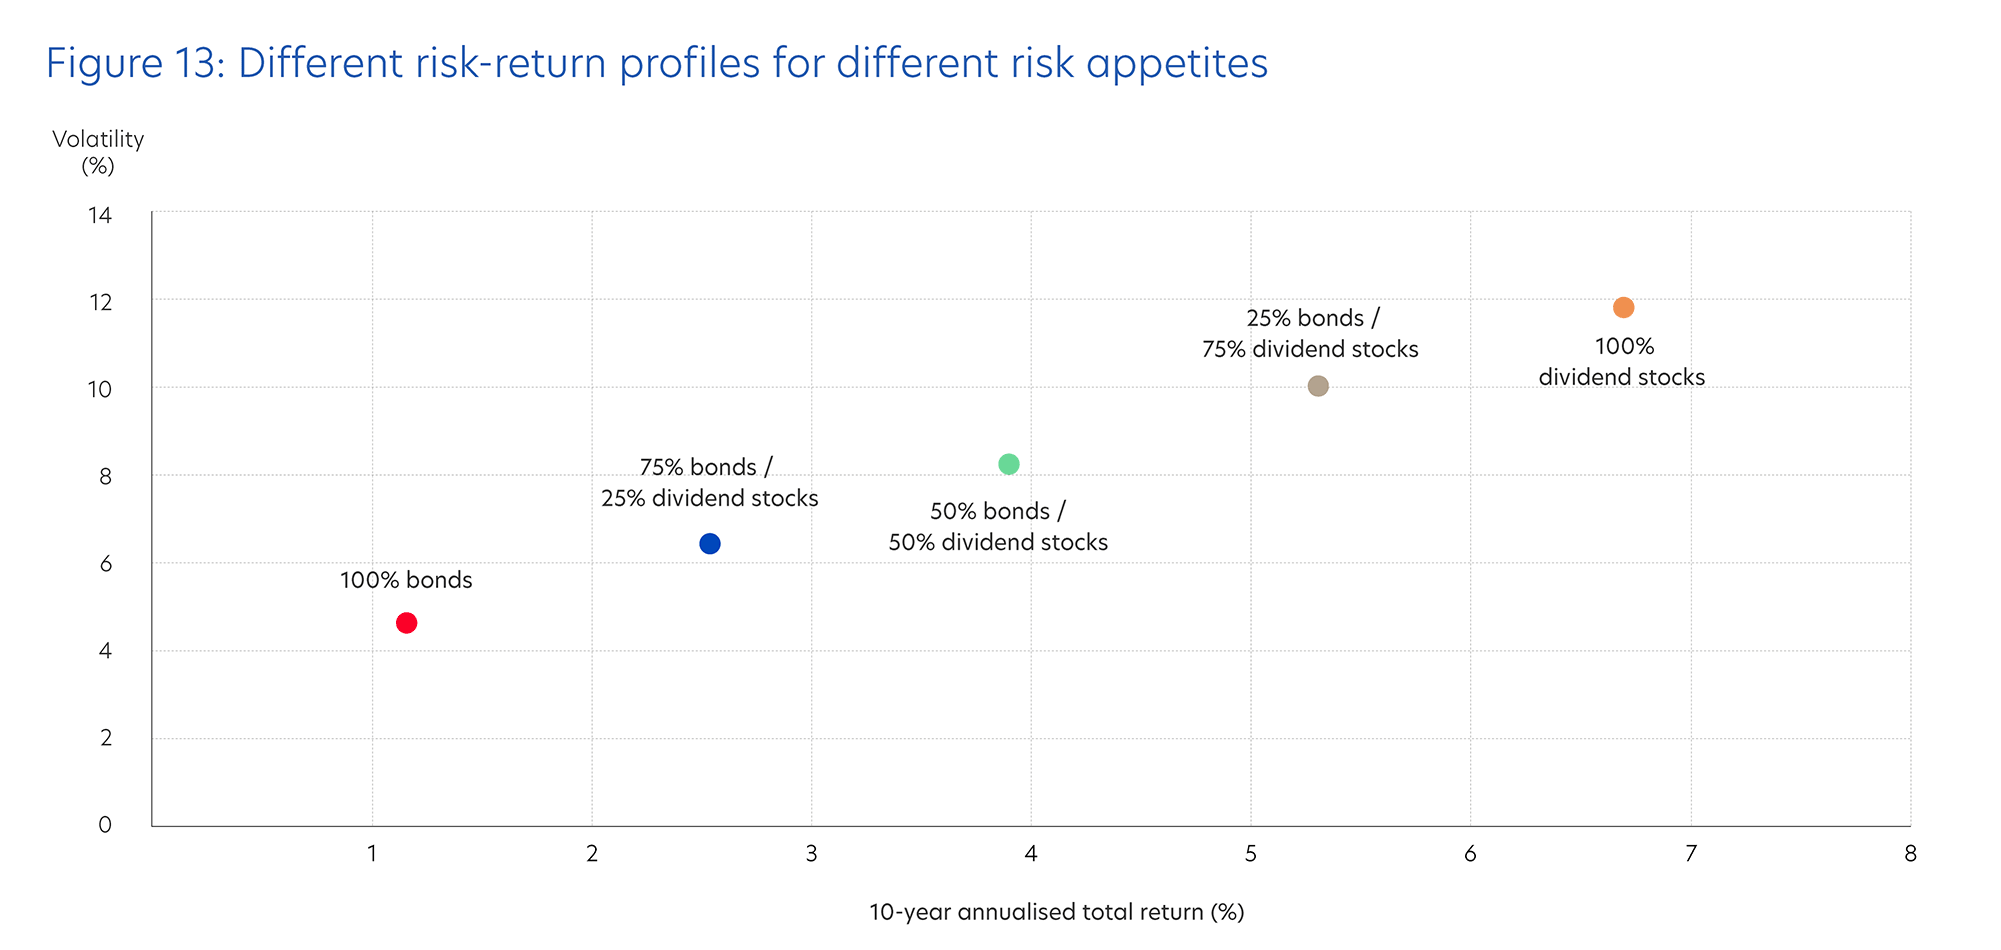
Bonds refer to investment grade bonds, based on Bloomberg Aggregate Corporate Index. Dividend stocks are based on MSCI World High Dividend Yield Index.
Source: Bloomberg (31 May 2024)
Your risk appetite should be the primary consideration when investing. Evaluate how much risk you are comfortable taking before deciding on your allocation to dividend stocks and investment grade bonds. If you are more risk-averse, consider a higher allocation to bonds. If you are able to take on more risk, allocate a higher proportion of your portfolio to dividend stocks.
The key is to find the right mix that allows you to balance income generation and growth in a way that suits your risk tolerance and goals.
Additional Resources
Contact a UOB Advisor
Download a digital copy
Get more investment insights
Credits
Credits
Managing Editor
- Winston Lim, CFA
Singapore and Regional Head,
Deposits and Wealth Management
Personal Financial Services
Editorial Team
- Abel Lim
Singapore Head,
Wealth Management
Advisory and Strategy - Michele Fong
Head, Wealth Advisory and Communications
Editorial Team (cont’d)
- Tan Jian Hui
Investment Strategist,
Investment Strategy and Communications - Low Xian Li
Investment Strategist,
Investment Strategy and Communications - Zack Tang
Investment Strategist,
Investment Strategy and Communications - Sarah Sng
Intern
Important notice and disclaimers
The information contained in this publication is given on a general basis without obligation and is strictly for information purposes only. This publication is not intended to be, and should not be regarded as, an offer, recommendation, solicitation or advice to buy or sell any investment or insurance product and shall not be transmitted, disclosed, copied or relied upon by any person for whatever purpose. Any description of investment or insurance products, if any, is qualified in its entirety by the terms and conditions of the investment or insurance product and if applicable, the prospectus or constituting document of the investment or insurance product. Nothing in this publication constitutes accounting, legal, regulatory, tax, financial or other advice. If in doubt, you should consult your own professional advisers about issues discussed herein.
The information contained in this publication, including any data, projections and underlying assumptions, are based on certain assumptions, management forecasts and analysis of known information and reflects prevailing conditions as of the date of the publication, all of which are subject to change at any time without notice. Although every reasonable care has been taken to ensure the accuracy and objectivity of the information contained in this publication, United Overseas Bank Limited (“UOB”) and its employees make no representation or warranty of any kind, express, implied or statutory, and shall not be responsible or liable for its completeness or accuracy. As such, UOB and its employees accept no liability for any error, inaccuracy, omission or any consequence or any loss/damage howsoever suffered by any person, arising from any reliance by any person on the views expressed or information contained in this publication.
Any opinions, projections and other forward looking statements contained in this publication regarding future events or performance of, including but not limited to, countries, markets or companies are not necessarily indicative of, and may differ from actual events or results. The information herein has no regard to the specific objectives, financial situation and particular needs of any specific person. Investors may wish to seek advice from an independent financial advisor before investing in any investment or insurance product. Should you choose not to seek such advice, you should consider whether the investment or insurance product in question is suitable for you.

We use cookies to improve and customise your browsing experience. You are deemed to have consented to our cookies policy if you continue browsing our site.